StippleGen
StippleGen is a free, open source, and cross-platform application from Evil Mad Scientist Laboratories that can create stipple drawings and “TSP art,” from image files.
Contents
Introduction[edit]

One of the perennial problems that we have come across in a variety of contexts, including CNC artwork and producing artwork for the Egg-Bot, is the difficulty of creating good-quality toolpaths– i.e., vector artwork representing halftones –when starting from image files. One of the finest solutions that we’ve ever come across is Adrian Secord's algorithm, which uses an iterative relaxation process to optimize a weighted Voronoi diagram, mathematically producing a set of points (stipples) that can closely approach the appearance of a traditional stipple drawing.
Another important technique is TSP art, where the image is represented by a single continuous path. You can generate a path like this by connecting all of the dots in a stipple diagram. Designing a route that visits each dot exactly once (and minimizing the distance travelled) is an example of the famous Travelling Salesman Problem (or just “TSP”), and an optimal TSP path can give a surprisingly good grayscale representation of an image. From the standpoint of toolpaths (for the Egg-bot and most other CNC machines), a TSP path is even nicer than stipples, because little or no time is spent raising and lowering the tool.
StippleGen is easy-to-use software that can generate TSP and stipple drawings from input images. It saves its files as editable, Eggbot-ready Inkscape SVG files, which can in turn be opened by other vector graphics programs, or re-saved as PDF files for use in other contexts. It can also generate a TSP path from the stippled image, and either save that path as an SVG file or simply use that path as the order of plotting for the stipple diagram.
You can read an extended introduction to StippleGen at Evil Mad Scientist Laboratories. An introduction to StippleGen version 2 is also available here.
Download[edit]
StippleGen is free and open source software, written in the Processing development environment. It comes ready to run on Mac, Windows, and Linux, and it is available for download here. The current version number is 2.31.
The download includes ready-to-run platform-specific versions of StippleGen for Mac, Windows, and Linux, as well as the source code. Current Mac and Windows versions include Java. For linux, you will need to have a recent version of Java installed on your computer.
Quick Start[edit]
- Press the "Load Image" button to load your image file, usually JPG or PNG format.
- Adjust the "Stipples" slider for the dot density that you want-- more stipples takes longer to run.
- Allow it to run until the stipple distribution stops changing much, and adjust the display options (dot size and so forth) to your taste.
- Press the Pause button to calculate the TSP path between the stipples.
- Press one of the "Save" buttons to save the stipple locations or the path between them to an SVG file.
Detailed Usage[edit]

When you first open up StippleGen, you will be presented with this window, which shows the drawing in progress (in the top part) and a set of controls below that. Rather than present you with a blank screen, StippleGen automatically loads a demo image (source) upon launch, and begins calculating. This way, you can try out the program, even if you don't have a good image of your own to start with. And, you can stop it at any time by loading a new image.
.jpg)
All of StippleGen's controls are accessed through the graphical user interface located in the lower part of the screen, in the gray bar. In what follows, we will go over the usage of the individual controls within the interface.
Loading an image file[edit]

To load a new image file, click the "Load Image File" button that is located above the "save" buttons. You can open any image file in .png, .jpg, .tga, or (non-animated) .gif formats. The file name must end in one of the following: .png, .jpg, .tga, .gif, .PNG, .JPG, .TGA, or .GIF.

As soon as a new image is loaded, StippleGen will "sprinkle" an initial weighted distribution of points over the image and then begin to calculate an initial Voronoi diagram from those points. During this process, you will see something like the image shown above, which is the set of Voronoi cells for the initial point distribution. Depending on the number of stipples being calculated, this may be a matter of moments or minutes.

After the initial Voronoi diagram is calculated, StippleGen will display the stipple locations that it has calculated. This "first guess" is usually quite crude— as you can see above — and will improve dramatically as you allow StippleGen to run for a while.
Aside: The calculation of the stipple point locations through Secord's algorithm is an iterative process. For any given "generation," the process begins with an initial set of points— whether that's the initial set of "sprinkled' points, or the output from the previous generation. The Voronoi diagram of those points is then calculated, and each point is moved to the weighted centroid of its Voronoi cell. That distribution of points then serves as the starting point for the subsequent generation.
Once you have allowed StippleGen to run for some generations, the set of stipples will relax into their optimal locations, and the drawing will cease to exhibit substantial changes from generation to generation. The actual duration of elapsed time before it "settles in" depends primarily on the number of stipples that you are using, but (generally speaking) the stipple drawings start to look reasonably good after around 40 generations.
Primary Controls[edit]

The two primary controls— which control the number and color of the stipples —are located in the upper-left portion of StippleGen's interface. Changing either setting will restart the calculation from the beginning, as though you had just loaded a new file.
Stipple Count[edit]

You can adjust the number of stipples used in the calculation by dragging the position of the stipple count slider, labeled "STIPPLES." The default stipple count is 2,000, and it can be adjusted as high as 10,000. When you adjust the stipple count, you may wish to also wish to adjust your display options to make the resulting image more clear.
Two important notes about changing the number of stipples: Using larger numbers of stipples will increase the time required per generation. And, again, please note that changing the number of stipples will restart the calculation from the beginning, as though you had just loaded a new file.
Super-Secret Bonus Trick: Press the 'x' key on your keyboard while StippleGen is running to increase the high end of the stipple count slider all the way up to 50,000. (We make no guarantee of how well StippleGen actually runs with more than 10k stipples. Our best guess: it takes its sweet time.)
Stipple Color[edit]
StippleGen can create stipple drawings either with black dots on a white background or white dots on a black background. By default, StippleGen will begin drawing with black stipples on a white background. This is usually the best choice for working with images that are predominantly light in color.
However, the most important reason to pick one color scheme or the other may be the intended application of the resulting drawing. If, for example, you will be drawing with black ink on an egg, you will probably want to pick black stipples and a white background. On the other hand, if you will be carving into a black panel, you may prefer white features on a black background.
To toggle between the two color schemes, press the wide button underneath the stipple-count slider, labeled with the current color scheme (typically "BLACK STIPPLES, WHITE BACKGROUND"). Pressing this button will switch the color scheme and restart the calculation from the beginning, as though you had just loaded a new file. Also, if you wish to restart the calculation for any reason, pressing this button twice is a good way to do that.

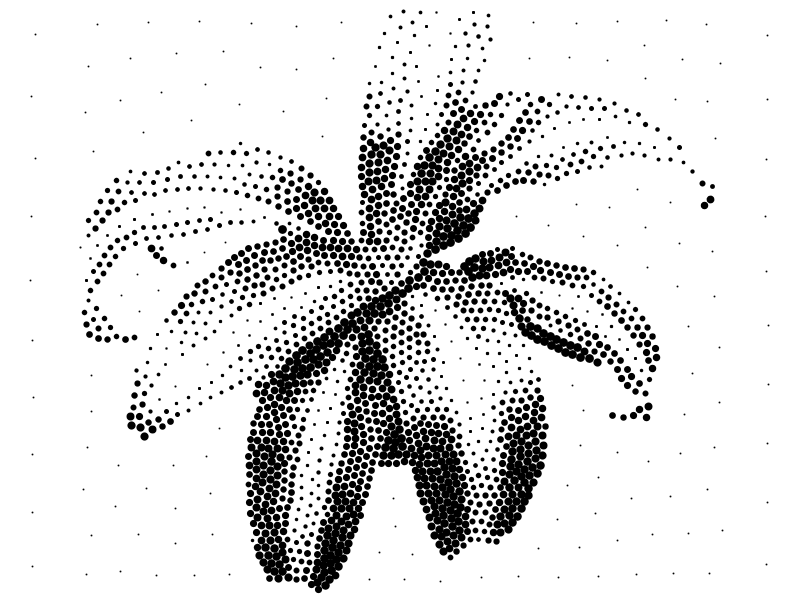
Shown above are two stipple drawings made from the same image of a corn plant, a sample image from here. One drawing is made with black dots on a white background, and the other has white dots on a black background. However, each drawing has 2000 dots and the parameters are otherwise identical. In this case, as the source image was predominantly white, the image with the white background is of considerably higher quality, as the dots are concentrated in the area of interest, rather than in the background.

Here now we have a better use of the black background: Mark Twain in 5000 stipples. (Image source.)
Display Options[edit]
The display options change how (and even, whether) the stipples are displayed, but do not actually affect their positions. These can be changed at any time without harming the stipple calculation, however, the results may not be visible (or fully applied) until the next generation is displayed.
Dot Size and Range[edit]

There are two controls for the stipples size: Minimum dot size and dot size range.
By default, the stipples displayed on the screen are of varying diameter, where the diameter of any given stipple depends upon the density of the "underlying" original image. When drawing black dots on a white background, the black dots are larger when over darker portions of the original image. When drawing white dots on a black background, the white dots are larger when over brighter portions of the original image.

The stipple size is controlled directly by two variables, the "Min. Dot Size" and the "Dot Size Range." The minimum dot size is the size of the smallest dots on the screen are, in pixels. If the size range is nonzero, then the dot size will scale with the image density, and the range is a multiplicative factor. If the size range is set to zero (as shown above), the stipples will all be the same size.

You can also adjust the size range to be much larger, for a different final effect. However, it is interesting to note that human-drawn stipple drawings tend to have a size range not much above 3-4. Also, be aware that if you are using StippleGen to create artwork for CNC tools, there may be a minimum feature size (e.g., pen width) that is not accurately represented by the tiny dots shown here.

When working with larger numbers of stipples, it is particularly important to scale down the minimum dot size, so that the stipples do not tend to overlap so much. Doing so allows you to use StippleGen to generate artwork of larger scale, too.
White Cutoff[edit]
You can use the "White Cutoff" slider can be to hide stipples in regions of very low density, for example if you find occasional black dots (correctly representing average density) to be distracting on a light-colored background.

In our demo image above, we have now adjusted the "White Cutoff" slider to 0.07, which hides much of the background.
Note 1: The "White Cutoff" slider will relabel itself "Black Cutoff" when working with white dots on a black background.
Note 2: While changing the white cutoff value will not affect the calculation of stipple locations, it does affect which stipples will be included in the output files. Because of this, changing the white cutoff will restart the calculation of the TSP path, if you change it while in "paused" mode. You can read more about the paused mode below.
Image and Voroni Cell Backgrounds[edit]

In addition to the display options that change the dot sizes and white cutoff, there are also two options to show a little more detail about ongoing calculations. These do not actually affect the calculations nor output of the program in any way— they are provided just because it's neat to be able to peek at these things.

Pressing the "Image BG" button will show the scaled original image in the background behind the stipples.

Pressing the "Cells" button will show the Voronoi cells in the background behind the stipples. It will also show the stipple locations (from the previous generation) in a lighter color, so that you can monitor the progress.

Finally, you can turn on both options, to view the original image and the Voronoi cells at the same time.
Pause / TSP Path[edit]

When you press the "Pause" button, StippleGen ceases calculation of the stipple locations, and begins calculating the "TSP" path between the points. The lower button, "Plotting Path," can hide or show the path during this part of the calculation. (Neither of these buttons actually affects the stipple location of the stipples, except to pause it.)
Additional details about the TSP path calculation process are in the next section.
Saving an SVG File[edit]
StippleGen is capable of saving the drawing that it has created in two different styles. Most obviously, it can save a true "stipple drawing" -- like what is shown on the screen above, where the image is represented by a series of dots. The other style of drawing is a "TSP path," where the thing that is saved is not the set of points, but a single continuous path that connects the points.
There are two steps to the process of saving a file:

First, click the "Pause" button. (This ends the process of calculating stipple locations, and begins the process of calculating the TSP path between those locations.)
Then, and usually after waiting for a moment, press one of the two buttons to either save the stipple drawing or the TSP path. You will be prompted for the location to save the file.
If you press one of the two save buttons before you have paused, StippleGen will not present you with a dialog box to save the file, but will instead go into the paused mode. If this happens, you can press the save button again, now that it's paused.
If you want to save both types of file, you can do so, one after the other.
Calculating the TSP Path[edit]
When you press the "Pause" button, StippleGen ceases calculation of the stipple locations, and begins calculating the "TSP" path between the points. You can press the lower button, "Plotting Path" to hide or show the path.
The TSP ("travelling salesman problem") path is an efficient route plotted between the stipple locations. And, depending on how you plan to use StippleGen's output, this part of the process may or may not be important to you:
- If you are creating a set of stipple points for use on the Eggbot, the order in which the points are plotted is given by their order in the file. If you allow the TSP path to be calculated— at least until the end of the "rats nest" stage —will dramatically reduce plotting time.
- If you are creating a set of stipple points for other CNC machines, the plot order may or may not affect downstream applications, depending on whether or not there is a separate optimization stage later, when creating your toolpath.
- If you are creating a set of stipple points for a different application, the point order is usually not important at all.
- If you are creating a true "TSP path" as your primary output, this stage of the calculation is just as important as the stipple calculation. You should allow it to run until it is optimal or you run out of patience.
Notes on calculating the plotting path:
Note 1: If you press the Pause again (to unpause/resume calculation), the TSP path will be lost, and a new one will be calculated (from scratch) when you press the pause button again. If you wish to restart the path for any reason, pressing this button twice is a good way to do that.
Note 2: The TSP path will also be restarted if you adjust the white cutoff parameter.
Note 3: Hiding or showing the TSP path is strictly a display option; it has no effect on the calculation or output. To choose whether your output file consists of points or lines, select one of the two save buttons: A stipple file consists of points, while the TSP path file consists of a single set of joined lines.

Let's begin with a nicely optimized corn plant stipple drawing, with 10,000 stipple points. (At this stage we do not have any white cutoff.)

When you first press the "Pause" button, the path between the stipple locations looks like a rats nest, as the program goes through the coarsest stage of finding a path between the points. This stage may last for only a brief moment, particularly when working with relatively low numbers of stipples.

After a few moments the path between the points begins to look a little more rational— the rats nest has gone away. If your output will be a set of stipple points (as opposed to a TSP path), this is already sufficiently optimized, and you can save your file now.
If, on the other hand, your primary output is actually a TSP path, you'll want to let it run for a while longer. (One hint: an optimal TSP path will not have any line segments that cross.)
(If you're wondering what happened to the points, we've just reduced the min. dot size and the size range here, so that you can see the path better.)

For this path, we've (1) used the white cutoff to hide the background and (2) allowed it to run for a few more minutes. This path probably won't get much better, so it's a good time to save the TSP path file. There are some little defects, but we're probably better off opening up the file in Inkscape at this point to edit away the bad path segments by hand.
Saving a Stipple Drawing[edit]
Once in paused mode, press the button labeled "Save Stipple File" to save your stipple drawing as an SVG file.

Here's what the corn plant drawing looks like, opened up in Inkscape. (See below for more about the file format.)

The drawing is made up of a very large number of small circles, whose size is determined by the dot sizes in StippleGen.
The stipple drawing can be used for almost anything at this point.
This image that we've drawn on the egg was rendered with only 2000 stipples. Properly tuned for making dots rapidly, the Eggbot can plot about four stipples per second, so this kind of a plot can take as little as ten minutes, and can actually produce a remarkable likeness of a photo.
Saving a TSP Path Drawing[edit]
Once in paused mode, press the button labeled 'Save "TSP Path"' to save the TSP path drawing as an SVG file.

Here's what the corn plant TSP path drawing looks like, opened up in Inkscape. (See below for more about the file format.)

And now, we've edited the path to remove a couple of the distracting segments, using Inkscape's path editing tools. We're now ready to plot this path.

Because this is essentially one continuous path, with almost no pen-up/pen-down motion, the whole drawing can be plotted in a minute or two.
File Format[edit]
The file is saved as an Inkscape SVG file that can be opened with Inkscape, the superb (and free) vector graphics editor, or other applications that can open and edit Inkscape SVG files.
While the SVG file can be modified to your heart's content and subsequently saved in a wide variety of formats, the SVG file is initially formatted to be "Eggbot ready." That is to say, the drawing is centered in a document that is 3200 × 800 pixels, so that it can be used (without modification) as input for an Eggbot.
Exit[edit]

To quit StippleGen, press the Quit button.
StippleGen will quit immediately when you press the button, without prompting you to save your drawing. (So, be sure to save first if you wish to do so.)
Source Code[edit]
The StippleGen source code is available at GitHub. To run the code from source, you'll need to download Processing, and install the toxiclibs library and the ControlP5 library. You don't need to download these libraries separately; install and start Processing, then go to Sketch | Import Library... | Add Library... , search for them and click Install, and it will install them in the right place automatically. (Update the "sketchbook path" in the Preferences if you don't want them installed in a "processing" subdir of your home folder.)